Message Boards Message Boards

Under the sea: nutrition and recipe risk analysis of aquatic foods

Posted 1 month ago

Magnesium levels in sea vegetables vs nuts

Attachments:
POSTED BY: Gay Wilson
5 Replies
seaVegNames = {"dulse", "kombu", "nori", "kelp seaweed", 
   "irishmoss seaweed", "wakame", "watercress", "agar-agar", 
   "spirulina", "watercress", "water spinach", "lemongrass"};
seaVegData = 
  AssociationThread[seaVegNames, 
   Map[Interpreter["Food"][#] &, seaVegNames]];
seaVegLabels = AssociationThread[seaVegNames, Map[# &, seaVegNames]];
magnesiumContentSeaVeg = 
  EntityValue[Values[seaVegData], "RelativePotassiumContent", 
   "EntityAssociation"];
nutNames = {"almonds", "Brazil nuts", "cashews", "peanuts", "walnuts",
    "pecans", "hazelnuts"};
nutData = 
  AssociationThread[nutNames, Map[Interpreter["Food"][#] &, nutNames]];
nutLabels = AssociationThread[nutNames, Map[# &, nutNames]];
magnesiumContentNuts = 
  EntityValue[Values[nutData], "RelativePotassiumContent", 
   "EntityAssociation"];
combinedMagnesiumContent = 
  Join[magnesiumContentSeaVeg, magnesiumContentNuts];
combinedMagnesiumContentLabels = Keys[Join[seaVegLabels, nutLabels]];
BarChart[Values[combinedMagnesiumContent], 
 ChartLabels -> 
  Placed[Map[Rotate[#, Pi/4] &, combinedMagnesiumContentLabels], 
   Below], ChartStyle -> "Rainbow", 
 PlotLabel -> "Potassium Content Comparison"]

enter image description here

And that is the detailed exploration of aquatic foods that we focus on, the nutritional aspects and safety that they have in our culinary uses; it's not like we're a couple of scholars going out for lunch it's more like we discuss the analysis of risks that we have with cooking recipes..and leave that to the sea vegetables and bivalves because the oysters, the mussels, and the clams, they know that they integration of the Wolfram Language for visualization and data analysis strengthens their informational value, and showcases the comparisons of magnesium content. But it's not just magnesium, we can also provide actionable insights into potassium.

redAlgae = 
  Interpreter["Species"][{"Porphyra", "Pyropia", "Palmaria palmata", 
    "Gracilaria", "Gelidium", "Delesseria sanguinea", 
    "Chondrus crispus", "Eucheuma", "Gigartina", 
    "Rhodymenia palmata"}];
speciesDetails = 
  EntityValue[redAlgae, {"Phylum", "Genus"}, "PropertyAssociation"];
ResourceFunction["NiceGrid"][speciesDetails]

enter image description here

And I wouldn't want to give the wrong impression but I'm pretty sure that potassium content between nuts and sea vegetables is a singular thing and if we only knew the iron content in various bivalves compared to beef us culinary professionals and enthusiasts will be softly weeping, when we observe the safety aspects of food safety rules. I mean what if you wanted to include some bivalves and you had them, if it makes your evening out that much more palatable. You could apply computational tools in food science until you're purple and blue in the face but the thing is to eat it, and that's what I would do honestly I would probably cook a bunch of bivalves and sea vegetables in order to more properly adhere to FDA guidelines.

bivalvesAndBeefNames = {"oysters", "beef", "scallops", "crab", 
   "shrimp"};
bivalvesAndBeefInterpret = 
  AssociationThread[
   bivalvesAndBeefNames, (Interpreter["Food"][#1] &) /@ 
    bivalvesAndBeefNames];
ironContent = 
  AssociationThread[Keys[bivalvesAndBeefInterpret], 
   EntityValue[Values[bivalvesAndBeefInterpret], 
    "RelativePotassiumContent"]];
ironContentSorted = 
  ReverseSortBy[ironContent, #["RelativePotassiumContent"] &];
bivalveLabels = Keys[ironContentSorted];
customColors = 
  Map[If[# === "beef", ColorData["HTML", "DarkRed"], 
     ColorData["Aquamarine"][3]] &, bivalveLabels];
BarChart[ironContentSorted, 
 ChartLabels -> Placed[Map[Rotate[#, Pi/4] &, bivalveLabels], Below], 
 PlotLabel -> "Potassium Content in Bivalves vs Beef", 
 AxesLabel -> "mg/g", ChartStyle -> customColors]

enter image description here

POSTED BY: Dean Gladish

A great expansion of the post -- thanks Dean! I appreciate your evaluation of potassium -- key to blood pressure, heart rhythm and muscle contraction. I love doing computational food science with the Wolfram Language. You're absolutely right about taking that next step -- adding culinary variety, such as sea vegetables and bivalves, to our diets. I aim to be better about this.

POSTED BY: Gay Wilson

Yes, I mean--absolutely, these evaluations you've shared really illustrate the consistency and detailed comparison of nutritional content. We're beginning to focus on the magnesium and potassium content in sea vegetables and nuts, as well as a broader analysis of the vocabulary of nutritional properties in different foods.

foodTypeEntities = EntityList[EntityClass["FoodType", All]];
items = EntityValue[RandomSample[foodTypeEntities, 4], "Name"];
items = {"dulse", "kombu", "nori", "kelp seaweed", "irishmoss seaweed",
   "wakame", "agar-agar", "spirulina", "water spinach", 
   "lemongrass"};
foodEntities = Map[Interpreter["Food"], items];
foodProperties = EntityProperties["Food"];
fetchFilteredPropertyHierarchy[items_, property_] := Module[
   {interpretedItems, propertyData, filteredData, labels},
   interpretedItems = AssociationThread[items,
     Map[
      Interpreter["Food"][#] &,
      items
      ]
     ];
   propertyData = Quiet[
     Check[
      AssociationThread[
       Keys[interpretedItems],
       EntityValue[
        Values[interpretedItems],
        property
        ]
       ],
      {}]
     ];
   filteredData = Select[
     propertyData,
     ! MatchQ[#, _Missing | {}] &
     ];
   labels = Keys[filteredData];
   {filteredData, labels}
   ];
handleDimensionlessQuantities[data_] := AssociationMap[
   If[
     QuantityQ[#] && UnitConvert[#, "DimensionlessUnit"] =!= #,
     QuantityMagnitude[UnitConvert[#, "DimensionlessUnit"]], If[
      QuantityQ[#] && UnitConvert[#, "g/g"] =!= #,
      QuantityMagnitude[UnitConvert[#, "g/g"]], If[
       QuantityQ[#], QuantityMagnitude[#],
       #
       ]
      ]
     ] &, data
   ];
standardizeQuantitiesToMicrograms[data_] := AssociationMap[
   If[
     QuantityQ[#] && UnitConvert[#, "Micrograms"] =!= #,
     QuantityMagnitude[UnitConvert[#, "Micrograms"]], If[
      QuantityQ[#], QuantityMagnitude[#],
      #
      ]
     ] &, data
   ];
visualizePropertyData[data_, labels_, property_] := Module[
  {convertedData, units, condition1, condition2, barChart1, barChart2},
  originalCondition = (Last[
       List @@ First[QuantityUnit /@ Values[data]]] == 1) &&
    (First[List @@ First[QuantityUnit /@ Values[data]]] == 1);
  condition2 = If[
    BooleanQ[originalCondition], originalCondition,
    False
    ];
  condition1 = ! condition2;
  convertedData = Which[
    StringContainsQ[ToString[property], "Percent"],
    handleDimensionlessQuantities[data],
    StringContainsQ[ToString[property], "g/g"],
    handleDimensionlessQuantities[data],
    True,
    standardizeQuantitiesToMicrograms[data]
    ];
  barChart1SuitsUnits = BarChart[
    Values[convertedData],
    ChartLabels -> Placed[Map[Rotate[#, Pi/4] &, labels], Below],
    PlotLabel -> Style[property, 16, Bold],
    AxesLabel -> {None, 
      Style[First[QuantityUnit /@ Values[data]], 12]},
    ChartStyle -> "DeepSeaColors",
    PlotRange -> All,
    GridLines -> Automatic,
    BaseStyle -> {FontFamily -> "Helvetica", FontSize -> 12}
    ];
  barChart2Suits1GramsGrams = BarChart[
    Values[
     AssociationMap[
      If[QuantityQ[#], QuantityMagnitude[#], #] &, 
      Values[convertedData]
      ]
     ],
    ChartLabels -> Placed[Map[Rotate[#, Pi/4] &, labels], Below],
    PlotLabel -> Style[property, 16, Bold],
    AxesLabel -> {None, 
      Style[First[QuantityUnit /@ Values[data]], 12]},
    ChartStyle -> "DeepSeaColors",
    PlotRange -> All,
    GridLines -> Automatic,
    BaseStyle -> {FontFamily -> "Helvetica", FontSize -> 12}
    ];
  If[condition1, barChart1SuitsUnits, If[condition2,
    barChart2Suits1GramsGrams, Null
    ]
   ]
  ]
allValuesZeroQ[data_] := Total[QuantityMagnitude /@ Values[data]] == 0;
barCharts = {};
Do[
  Quiet[
   Check[
    {data, labels} = fetchFilteredPropertyHierarchy[items, property];
    If[
     (Length[data] >= Length[items]/2 && ! allValuesZeroQ[data]),
     Print[Values[data]];
     Print[labels];
     Print[visualizePropertyData[data, labels, property]];
     AppendTo[barCharts, 
      visualizePropertyData[data, labels, property]];
     ], Null
    ]
   ],
  {property, foodProperties}
  ];
half = Ceiling[Length[barCharts]/2];
biggerBarChart = Take[barCharts, half];
smallerBarChart = Drop[barCharts, half];
ImageCollage[biggerBarChart, Background -> None]
ImageCollage[smallerBarChart, Background -> None]

Given some more meaningful data, here's what we've been able to extract--via said foundation of computational food science we can understand the full nutritional profile of aquatic foods and how to make informed dietary choices and, we can provide some insight on this amazing topic. I'd love to hear your thoughts on these visualizations. I started out staring at the data for relative magnesium content in sea vegetables compared to nuts as well as the potassium content in various bivalves versus beef, and now I'm ready to incorporate a more comprehensive analysis. Here's the comparative view.

Image Collage 1

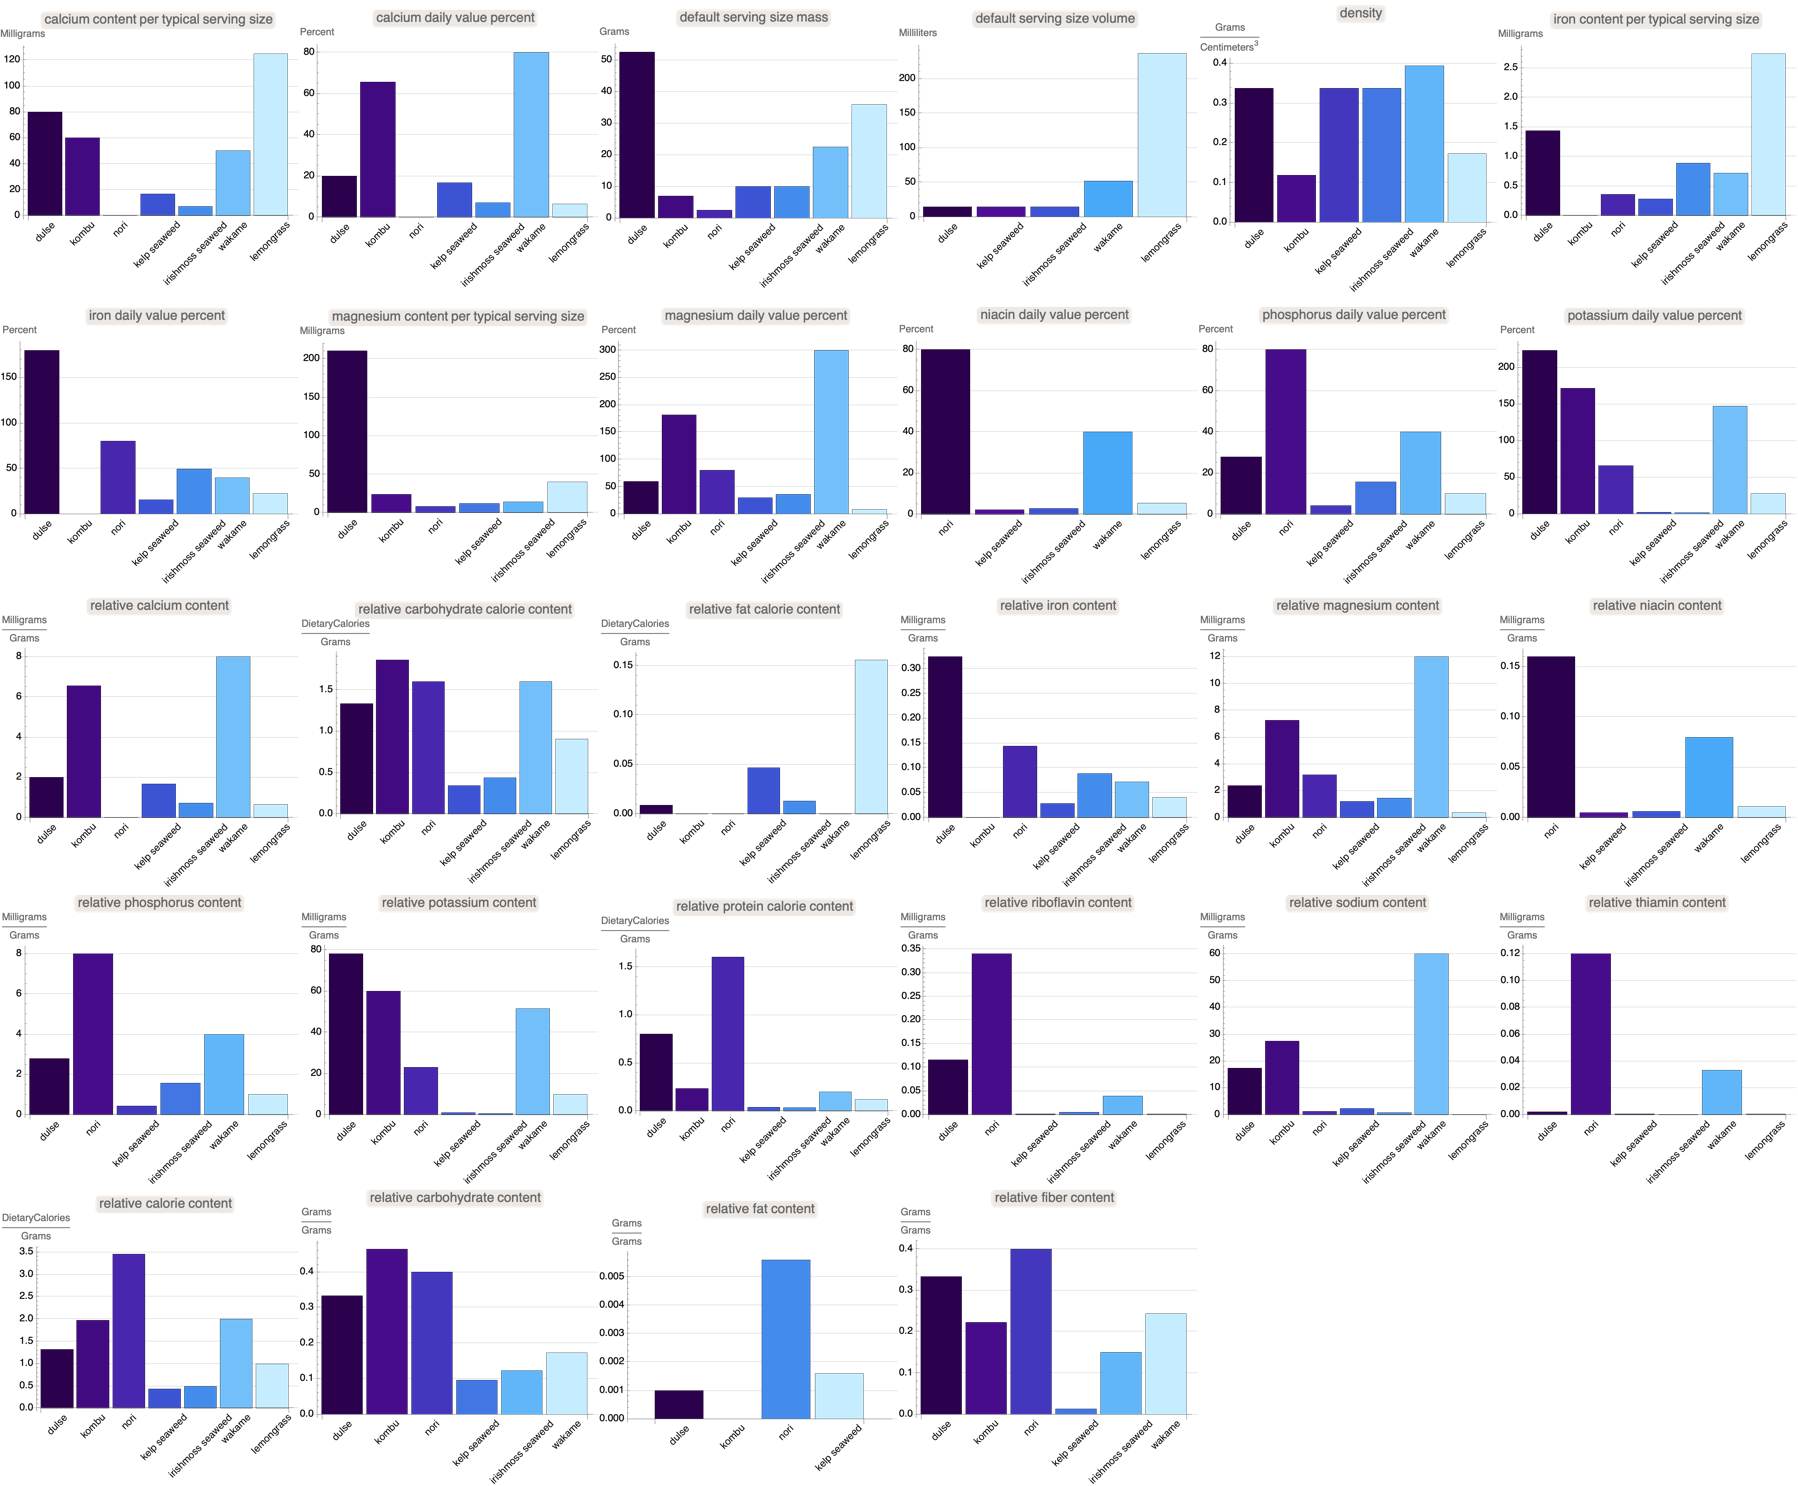
My own observation is that protein, fat, sugar, and vitamin contents are relatively similar across various food items whether it's sea vegetables or nuts. It "turns out" we can look at the relative nutritional contributions of each food item, and then add in stuff like calcium, iron, and fiber content. I found this to be quite a convenient platform what with the fact that the Wolfram Language provides the nutritional analysis and visualization of fish and various sea vegetables; these are the food entities that Wolfram Language recognizes. We can filter out empty or missing values via the standardize dimensionless, numericize quantities function that provides needful consistency in presentation of data in a readable format.

Image Collage 2

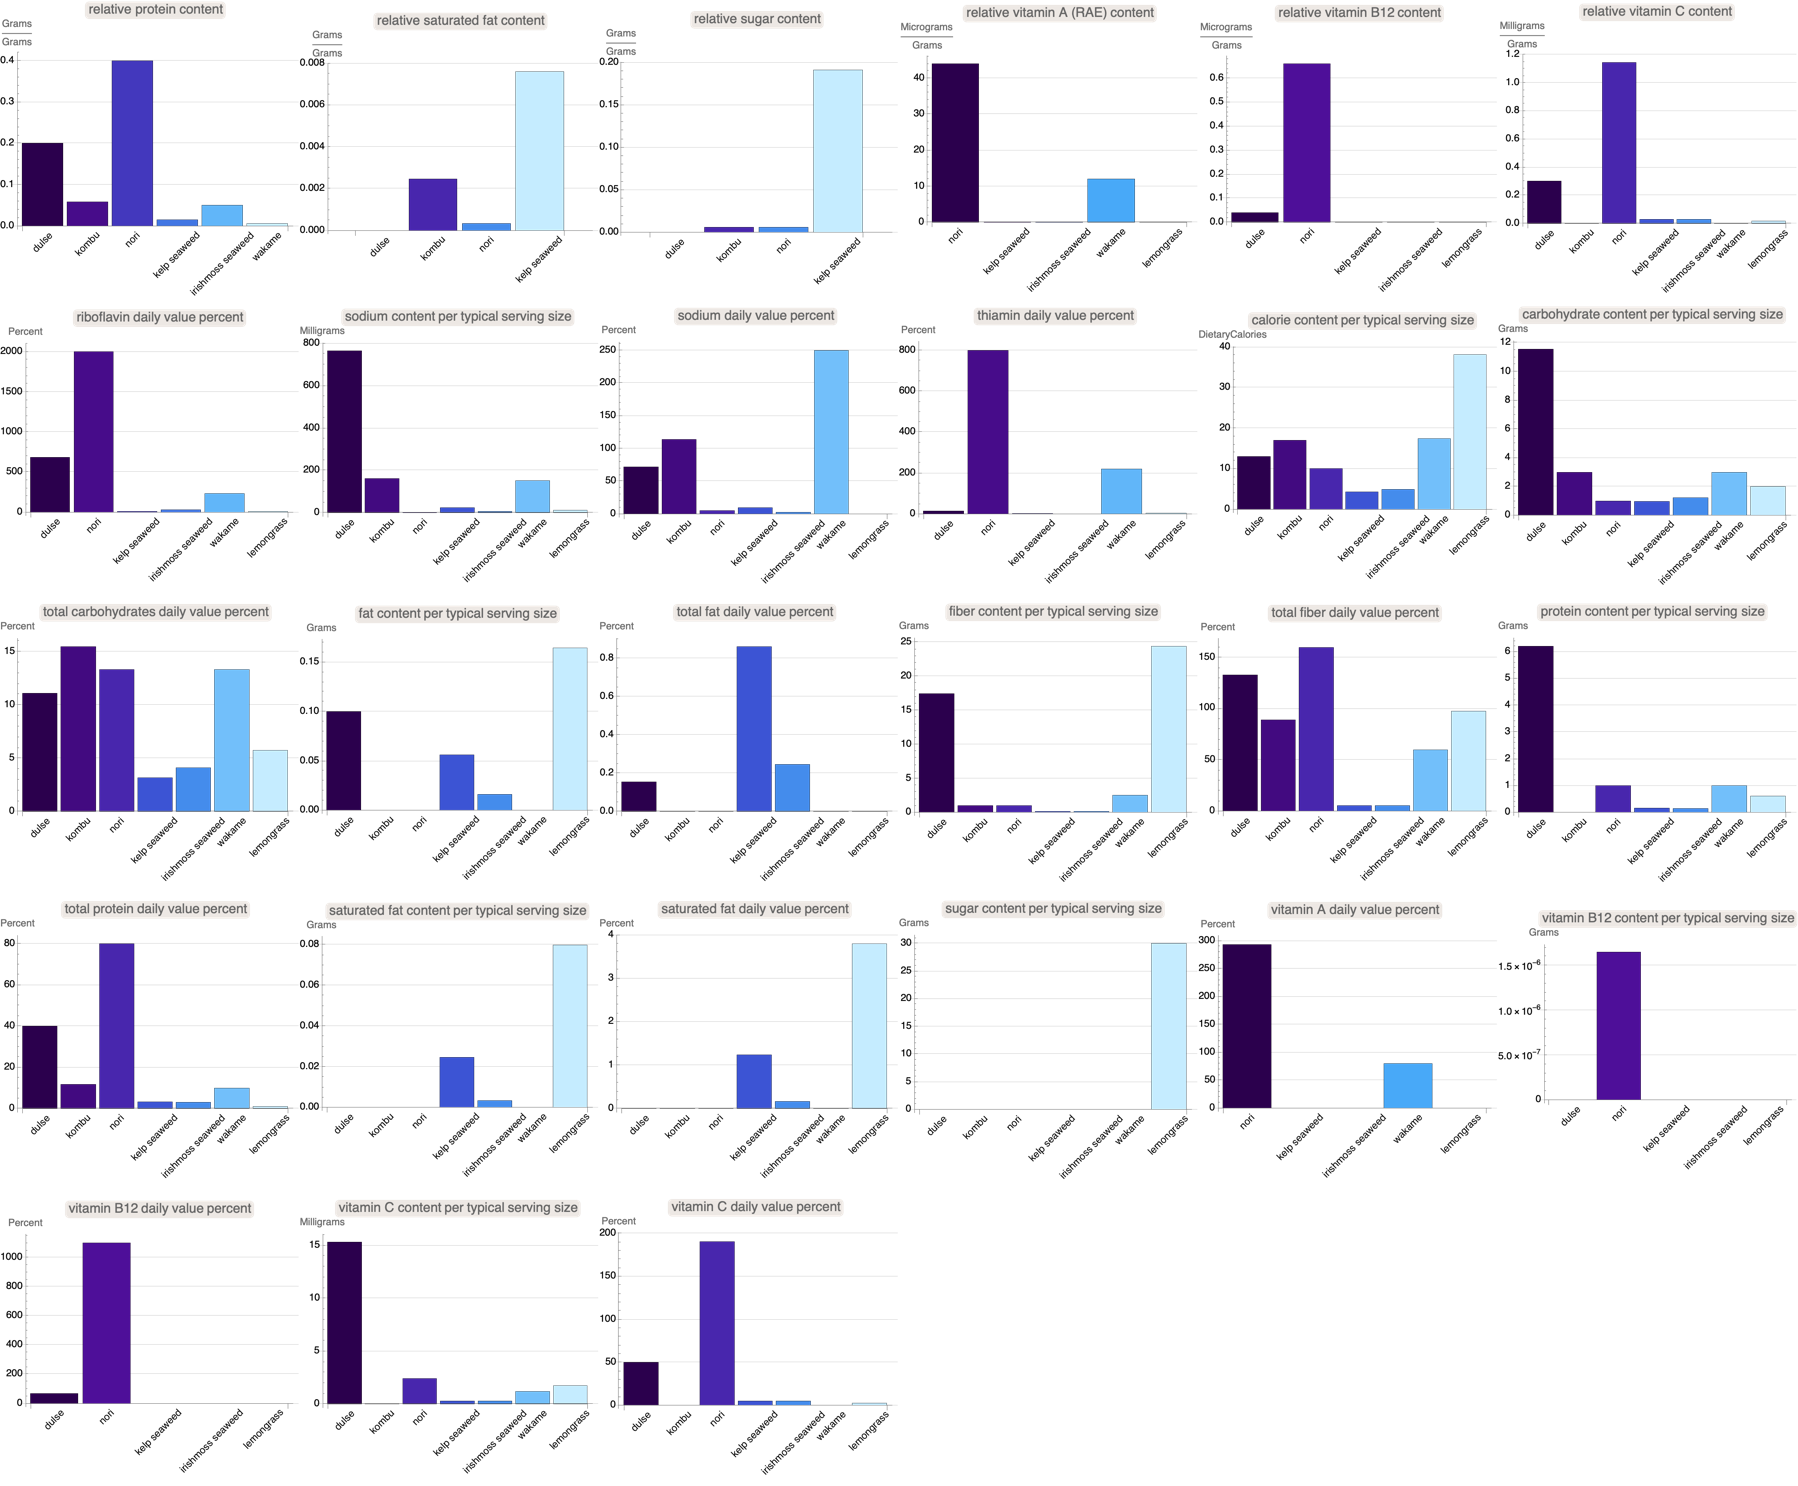
And so what we can do here for the users is vectorize all the food properties, fetch and visualize data for all kinds of interesting properties. I didn't want to do any matrix algebra and that is why these food property items (distinguished between percentages or "dimensionless"), I've standardized them to align with the micrograms unit type because once we start adding culinary variety we get many types of measurable unit quantities. Looking forward to your feedback and further discussion!

POSTED BY: Dean Gladish

Thanks Dean -- I appreciate your work expanding further into micronutrients and also macronutrients. I found your bar chart collages really interesting to explore, especially as a registered dietitian. For example, if I were advising a patient whether or not to add dulse (seaweed) flakes as a garnish or seasoning to their foods, the charts you created provide good insight for helping make that decision. I may advise a patient with an iron deficiency to use dulse flakes (since high in relative iron), but a patient with kidney disease not to use them (since high in relative potassium). Thanks again for your work with food and nutrition data in the Wolfram Language!

POSTED BY: Gay Wilson

enter image description here -- you have earned Featured Contributor Badge enter image description here Your exceptional post has been selected for our editorial column Staff Picks http://wolfr.am/StaffPicks and Your Profile is now distinguished by a Featured Contributor Badge and is displayed on the Featured Contributor Board. Thank you!

POSTED BY: Moderation Team
Reply to this discussion
Community posts can be styled and formatted using the Markdown syntax.
Reply Preview
Attachments
Remove
or Discard

Group Abstract Group Abstract