FindClusters
FindClusters[{e1,e2,…}]
partitions the ei into clusters of similar elements.
FindClusters[{e1v1,e2v2,…}]
returns the vi corresponding to the ei in each cluster.
FindClusters[data,n]
partitions data into n clusters.
Details and Options
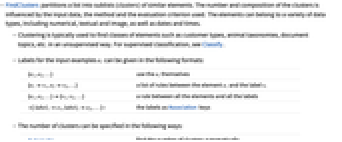
- FindClusters partitions a list into sublists (clusters) of similar elements. The number and composition of the clusters is influenced by the input data, the method and the evaluation criterion used. The elements can belong to a variety of data types, including numerical, textual and image, as well as dates and times.
- Clustering is typically used to find classes of elements such as customer types, animal taxonomies, document topics, etc. in an unsupervised way. For supervised classification, see Classify.
- Labels for the input examples ei can be given in the following formats:
-
{e1,e2,…}use the ei themselves {e1v1,e2v2,…}a list of rules between the element ei and the label vi {e1,e2,…}{v1,v2,…}a rule between all the elements and all the labels label1e1,label2e2,…the labels as Association keys - The number of clusters can be specified in the following ways:
-
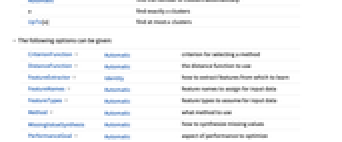
Automaticfind the number of clusters automatically nfind exactly n clusters UpTo[n]find at most n clusters - The following options can be given:
-
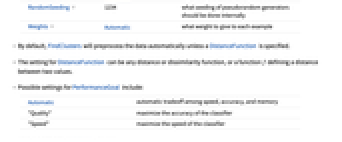
CriterionFunction Automaticcriterion for selecting a method DistanceFunction Automaticthe distance function to use FeatureExtractor Identityhow to extract features from which to learn FeatureNames Automaticfeature names to assign for input data FeatureTypes Automaticfeature types to assume for input data Method Automaticwhat method to use MissingValueSynthesisAutomatichow to synthesize missing values PerformanceGoal Automaticaspect of performance to optimize RandomSeeding 1234what seeding of pseudorandom generators should be done internally Weights Automaticwhat weight to give to each example - By default, FindClusters will preprocess the data automatically unless a DistanceFunction is specified.
- The setting for DistanceFunction can be any distance or dissimilarity function, or a function f defining a distance between two values.
- Possible settings for PerformanceGoal include:
-
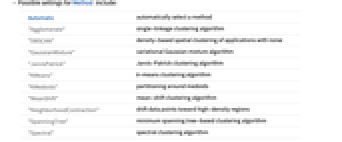
Automaticautomatic tradeoff among speed, accuracy, and memory "Quality"maximize the accuracy of the classifier "Speed"maximize the speed of the classifier - Possible settings for Method include:
-
Automaticautomatically select a method "Agglomerate"single-linkage clustering algorithm "DBSCAN"density-based spatial clustering of applications with noise "GaussianMixture"variational Gaussian mixture algorithm "JarvisPatrick"Jarvis–Patrick clustering algorithm "KMeans"k-means clustering algorithm "KMedoids"partitioning around medoids "MeanShift"mean-shift clustering algorithm "NeighborhoodContraction"shift data points toward high-density regions "SpanningTree"minimum spanning tree-based clustering algorithm "Spectral"spectral clustering algorithm - The methods "KMeans" and "KMedoids" can only be used when the number of clusters is specified.
- The methods "DBSCAN", "GaussianMixture", "JarvisPatrick", "MeanShift" and "NeighborhoodContraction" can only be used when the number of clusters is Automatic.
- The following plots show results of common methods on toy datasets:
- Possible settings for CriterionFunction include:
-
"StandardDeviation"root-mean-square standard deviation "RSquared"R-squared "Dunn"Dunn index "CalinskiHarabasz"Calinski–Harabasz index "DaviesBouldin"Davies–Bouldin index "Silhouette"Silhouette score Automaticinternal index - Possible settings for RandomSeeding include:
-
Automaticautomatically reseed every time the function is called Inheriteduse externally seeded random numbers seeduse an explicit integer or strings as a seed
Examples
open allclose allBasic Examples (4)
Find clusters of nearby values:
Represent clustered elements with the right-hand sides of each rule:
Represent clustered elements with the keys of the association:
Scope (6)
Cluster vectors of real values:
Cluster data of any precision:
Cluster Boolean True, False data:
Options (15)
CriterionFunction (1)
Generate some separated data and visualize it:
Cluster the data using different settings for CriterionFunction:
Compare the two clusterings of the data:
DistanceFunction (4)
Use CanberraDistance as the measure of distance for continuous data:
Clusters obtained with the default SquaredEuclideanDistance:
Use DiceDissimilarity as the measure of distance for Boolean data:
Use MatchingDissimilarity as the measure of distance for Boolean data:
Use HammingDistance as the measure of distance for string data:
Define a distance function as a pure function:
FeatureExtractor (1)
Find clusters for a list of images:
Create a custom FeatureExtractor to extract features:
FeatureNames (1)
Use FeatureNames to name features, and refer to their names in further specifications:
FeatureTypes (1)
Use FeatureTypes to enforce the interpretation of the features:
Compare it to the result obtained by assuming nominal features:
Method (4)
Cluster the data hierarchically:
Clusters obtained with the default method:
Generate normally distributed data and visualize it:
Cluster the data in 4 clusters by using the k-means method:
Cluster the data using the "GaussianMixture" method without specifying the number of clusters:
Generate some uniformly distributed data:
Cluster the data in 2 clusters by using the k-means method:
Cluster the data using the "DBSCAN" method without specifying the number of clusters:
Cluster the colors in 5 clusters using the k-medoids method:
Cluster the colors without specifying the number of clusters using the "MeanShift" method:
Cluster the colors without specifying the number of clusters using the "NeighborhoodContraction" method:
Cluster the colors using the "NeighborhoodContraction" method and its suboptions:
PerformanceGoal (1)
Generate 500 random numerical vectors of length 1000:
Compute their clustering and benchmark the operation:
Perform the same operation with PerformanceGoal set to "Speed":
RandomSeeding (1)
Generate 500 random numerical vectors in two dimensions:
Compute their clustering several times and compare the results:
Compute their clustering several times by changing the RandomSeeding option, and compare the results:
Weights (1)
Obtain cluster assignment for some numerical data:
Look at the cluster assignment when changing the weight given to each number:
Applications (3)
Find and visualize clusters in bivariate data:
Find clusters in  five‐dimensional vectors:
Cluster genomic sequences based on the number of element‐wise differences:
Properties & Relations (2)
FindClusters returns the list of clusters, while ClusteringComponents gives an array of cluster indices:
FindClusters groups data, while Nearest gives the elements closest to a given value:
Neat Examples (2)
Divide a square into n segments by clustering uniformly distributed random points:
Cluster words beginning with "agg" in the English dictionary:
Text
Wolfram Research (2007), FindClusters, Wolfram Language function, https://reference.wolfram.com/language/ref/FindClusters.html (updated 2020).
CMS
Wolfram Language. 2007. "FindClusters." Wolfram Language & System Documentation Center. Wolfram Research. Last Modified 2020. https://reference.wolfram.com/language/ref/FindClusters.html.
APA
Wolfram Language. (2007). FindClusters. Wolfram Language & System Documentation Center. Retrieved from https://reference.wolfram.com/language/ref/FindClusters.html