


AstroGraphics
AstroGraphics[primitives,options]
represents a two-dimensional view of space and the celestial sphere.
Details and Options
- AstroGraphics constructs maps of any region of the sky, as viewed on any date from anywhere in the solar system.
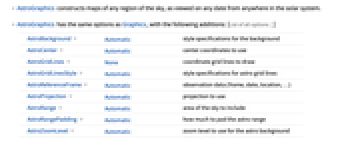
- AstroGraphics has the same options as Graphics, with the following additions: [List of all options]
-
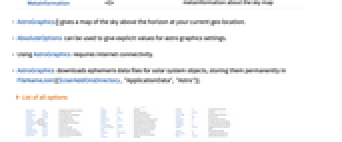
AstroBackground Automaticstyle specifications for the background AstroCenter Automaticcenter coordinates to use AstroGridLines Nonecoordinate grid lines to draw AstroGridLinesStyle Automaticstyle specifications for astro grid lines AstroReferenceFrame Automaticobservation data (frame, date, location, …) AstroProjection Automaticprojection to use AstroRange Automaticarea of the sky to include AstroRangePadding Automatichow much to pad the astro range AstroZoomLevel Automaticzoom level to use for the astro background MetaInformation<||>metainformation about the sky map - AstroGraphics[] gives a map of the sky above the horizon at your current geo location.
- AbsoluteOptions can be used to give explicit values for astro graphics settings.
- Using AstroGraphics requires internet connectivity.
- AstroGraphics downloads ephemeris data files for solar system objects, storing them permanently in FileNameJoin[{$UserAddOnsDirectory,"ApplicationData","Astro"}].
-
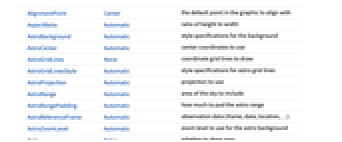
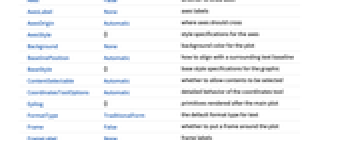
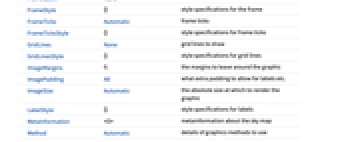
AlignmentPointCenterthe default point in the graphic to align with AspectRatioAutomaticratio of height to width AstroBackgroundAutomaticstyle specifications for the background AstroCenterAutomaticcenter coordinates to use AstroGridLinesNonecoordinate grid lines to draw AstroGridLinesStyleAutomaticstyle specifications for astro grid lines AstroProjectionAutomaticprojection to use AstroRangeAutomaticarea of the sky to include AstroRangePaddingAutomatichow much to pad the astro range AstroReferenceFrameAutomaticobservation data (frame, date, location, …) AstroZoomLevelAutomaticzoom level to use for the astro background AxesFalsewhether to draw axes AxesLabelNoneaxes labels AxesOriginAutomaticwhere axes should cross AxesStyle{}style specifications for the axes BackgroundNonebackground color for the plot BaselinePositionAutomatichow to align with a surrounding text baseline BaseStyle{}base style specifications for the graphic ContentSelectableAutomaticwhether to allow contents to be selected CoordinatesToolOptionsAutomaticdetailed behavior of the coordinates tool Epilog{}primitives rendered after the main plot FormatTypeTraditionalFormthe default format type for text FrameFalsewhether to put a frame around the plot FrameLabelNoneframe labels FrameStyle{}style specifications for the frame FrameTicksAutomaticframe ticks FrameTicksStyle{}style specifications for frame ticks GridLinesNonegrid lines to draw GridLinesStyle{}style specifications for grid lines ImageMargins0.the margins to leave around the graphic ImagePaddingAllwhat extra padding to allow for labels etc. ImageSizeAutomaticthe absolute size at which to render the graphic LabelStyle{}style specifications for labels MetaInformation<||>metainformation about the sky map MethodAutomaticdetails of graphics methods to use PlotLabelNonean overall label for the plot PlotRangeAllrange of values to include PlotRangeClippingFalsewhether to clip at the plot range PlotRangePaddingAutomatichow much to pad the range of values PlotRegionAutomaticthe final display region to be filled PreserveImageOptionsAutomaticwhether to preserve image options when displaying new versions of the same graphic Prolog{}primitives rendered before the main plot RotateLabelTruewhether to rotate y labels on the frame TicksAutomaticaxes ticks TicksStyle{}style specifications for axes ticks
List of all options
Examples
open allclose allBasic Examples (5)
Show a map of the current sky above you, showing the equatorial, ecliptic, galactic and horizon planes:
Show the sky above you on a given date, adding a background image:
Show an area of the sky around the star Betelgeuse:
Add constellation illustrations and remove the equatorial, ecliptic and galactic planes:
Visualize the neighborhood of the galactic center:
Compute weekly positions of Mars from January 2022 to July 2023:
Part of the trajectory was in retrograde motion:
Options (16)
AstroBackground (3)
AstroGraphics uses the "BlackSky" style by default:
Use the "WhiteSky" style, with white background and dark colors for the stars:
Specify styling directives for constellation:
AstroCenter (1)
Display Mercury and Venus, centering the map at the position of the Sun:
AstroGridLines (2)
Show astro grid lines of the given frame:
Add astro grid lines of frames other than the frame used to construct the map:
The equatorial grid has its North Pole very close to Polaris:
AstroGridLinesStyle (1)
Change the default style of the astro grid lines:
AstroProjection (1)
AstroRange (1)
Show 10 angular degrees around the current position of Jupiter:
Zoom in around Jupiter until you see the positions of the Galilean satellites:
AstroRangePadding (1)
Add 5 angular degrees of padding in all directions around the range including two stars:
AstroReferenceFrame (5)
By default, AstroGraphics uses the local horizon frame and the "Stereographic" projection:
Show the full sky, using the equatorial frame, in the "Equirectangular" projection:
Show the full sky, using the ecliptic frame, in the "Equirectangular" projection:
Show the full sky, using the galactic frame, with the result using the "Mollweide" projection:
Compute the position of the North Celestial Pole every 1000 years for the past 14000 years:
It was close to the star Vega around year −12000:
AstroZoomLevel (1)
Use different zoom levels to get different levels of background image quality:
Applications (6)
Construct the analemma of the Sun, formed by its positions every day at a fixed time for a year:
Draw weekly positions, here shown over the sky of a date close to the vernal equinox:
Show the same analemma over the sky of a date close to the summer solstice:
Plot the positions of Venus at noon, every day over a period of 8 years:
Show the southern sky at 2pm at your location:
Observe the transit of Venus in front of Jupiter, November 22, 2065, better viewed near the South Pole:
Visualize an annular solar eclipse:
Visualize the famous eclipse used by Eddington to confirm Einstein's prediction of light deflection:
Text
Wolfram Research (2022), AstroGraphics, Wolfram Language function, https://reference.wolfram.com/language/ref/AstroGraphics.html.
CMS
Wolfram Language. 2022. "AstroGraphics." Wolfram Language & System Documentation Center. Wolfram Research. https://reference.wolfram.com/language/ref/AstroGraphics.html.
APA
Wolfram Language. (2022). AstroGraphics. Wolfram Language & System Documentation Center. Retrieved from https://reference.wolfram.com/language/ref/AstroGraphics.html