


Predict
Predict[{in1out1,in2out2,…}]
generates a PredictorFunction that attempts to predict outi from the example ini.
Predict[data,input]
attempts to predict the output associated with input from the training examples given.
Predict[data,input,prop]
computes the specified property prop relative to the prediction.
Details and Options
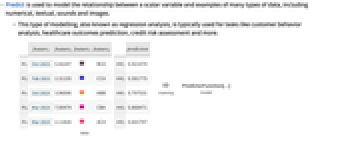
- Predict is used to model the relationship between a scalar variable and examples of many types of data, including numerical, textual, sounds and images.
- This type of modelling, also known as regression analysis, is typically used for tasks like customer behavior analysis, healthcare outcomes prediction, credit risk assessment and more.
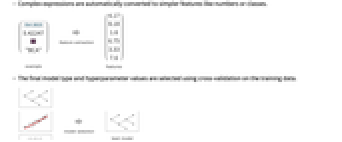
- Complex expressions are automatically converted to simpler features like numbers or classes.
- The final model type and hyperparameter values are selected using cross-validation on the training data.
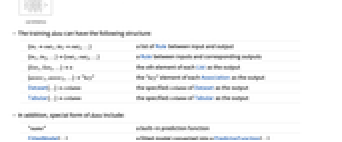
- The training data can have the following structure:
-
{in1out1,in2out2,…}a list of Rule between input and output {in1,in2,…}{out1,out2,…}a Rule between inputs and corresponding outputs {list1,list2,…}nthe nth element of each List as the output {assoc1,assoc2,…}"key"the "key" element of each Association as the output Dataset[…]columnthe specified column of Dataset as the output - In addition, special form of data include:
-
"name"a built-in prediction function FittedModel[…]a fitted model converted into a PredictorFunction[…] - Each example input ini can be a single data element, a list {feature1, …} or an association <|"feature1"value1,…|> .
- Each example output outi must be a numerical value.
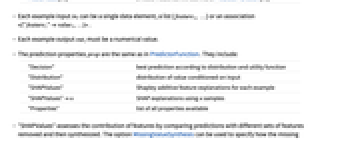
- The prediction properties prop are the same as in PredictorFunction. They include:
-
"Decision"best prediction according to distribution and utility function "Distribution"distribution of value conditioned on input "SHAPValues"Shapley additive feature explanations for each example "SHAPValues"nSHAP explanations using n samples "Properties"list of all properties available - "SHAPValues" assesses the contribution of features by comparing predictions with different sets of features removed and then synthesized. The option MissingValueSynthesis can be used to specify how the missing features are synthesized. SHAP explanations are given as deviation from the training output mean.
- Examples of built-in predictor functions include:
-
"NameAge"age of a person, given their first name - The following options can be given:
-
AnomalyDetector Noneanomaly detector used by the predictor AcceptanceThreshold Automaticrarer probability threshold for anomaly detector FeatureExtractor Identityhow to extract features from which to learn FeatureNames Automaticfeature names to assign for input data FeatureTypes Automaticfeature types to assume for input data IndeterminateThreshold 0below what probability density to return Indeterminate Method Automaticwhich regression algorithm to use MissingValueSynthesis Automatichow to synthesize missing values PerformanceGoal Automaticaspects of performance to try to optimize RecalibrationFunction Automatichow to post-process predicted value RandomSeeding1234what seeding of pseudorandom generators should be done internally TargetDevice "CPU"the target device on which to perform training TimeGoal Automatichow long to spend training the classifier TrainingProgressReporting Automatichow to report progress during training UtilityFunction Automaticutility as function of actual and predicted value ValidationSet Automaticdata on which to validate the model generated - Using FeatureExtractor"Minimal" indicates that the internal preprocessing should be as simple as possible.
- Possible settings for Method include:
-
 "DecisionTree"predict using a decision tree
 "GradientBoostedTrees"predict using an ensemble of trees trained with gradient boosting
 "LinearRegression"predict from linear combinations of features
 "NearestNeighbors"predict from nearest neighboring examples
 "NeuralNetwork"predict using an artificial neural network
 "RandomForest" predict from Breiman–Cutler ensembles of decision trees
 "GaussianProcess"predict using a Gaussian process prior over functions
- Possible settings for PerformanceGoal include:
-
"DirectTraining"train directly on the full dataset, without model searching "Memory"minimize storage requirements of the predictor "Quality"maximize accuracy of the predictor "Speed"maximize speed of the predictor "TrainingSpeed"minimize time spent producing the predictor Automaticautomatic tradeoff among speed, accuracy and memory {goal1,goal2,…}automatically combine goal1, goal2, etc. - The following settings for TrainingProgressReporting can be used:
-
"Panel"show a dynamically updating graphical panel "Print"periodically report information using Print "ProgressIndicator"show a simple ProgressIndicator "SimplePanel"dynamically updating panel without learning curves Nonedo not report any information - Information can be used on the PredictorFunction[…] obtained.
Examples
open allclose allBasic Examples (2)
Learn to predict the third column of a matrix using the features in the first two columns:
Predict the value of a new example, given its features:
Predict the value of a new example that has a missing feature:
Predict the value of a multiple examples at the same time:
Train a linear regression on a set of examples:
Get the conditional distribution of the predicted value, given the example feature:
Plot the probability density of the distribution:
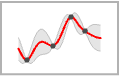
Plot the prediction with a confidence band together with the training data:
Scope (23)
Data Format (7)
Specify the training set as a list of rules between an input examples and the output value:
Each example can contain a list of features:
Each example can contain an association of features:
Specify the training set a list of rule between a list of input and a list of output:
Specify all the data in a matrix and mark the output column:
Specify all the data in a list of associations and mark the output key:
Specify all the data in a dataset and mark the output column:
Data Types (12)
Numerical (3)
Predict a variable from a number:
Predict a variable from a numerical vector:
Predict a variable from a numerical array or arbitrary depth:
Nominal (3)
Predict a variable from a nominal value:
Predict a variable from several nominal values:
Predict a variable from a mixture of nominal and numerical values:
Quantities (1)
Train a predictor on data including Quantity objects:
Use the predictor on a new example:
Predict the most likely price when only the "Neighborhood" is known:
Colors (1)
Predict a variable from a color expression:
Images (1)
Train a predictor to predict the colored area of an image:
Sequences (1)
Train a predictor on data where the feature is a sequence of tokens:
Missing Data (2)
Train on a dataset containing missing features:
Train a predictor on a dataset with named features. The order of the keys does not matter. Keys can be missing:
Predict examples containing missing features:
Information (4)
Extract information from a trained predictor:
Get information about the input features:
Get the feature extractor used to process the input features:
Get a list of the supported properties
Options (23)
AcceptanceThreshold (1)
Create a predictor with an anomaly detector:
Change the value of the acceptance threshold when evaluating the predictor:
Permanently change the value of the acceptance threshold in the predictor:
AnomalyDetector (1)
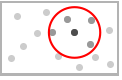
Create a predictor and specify that an anomaly detector should be included:
Evaluate the predictor on a non-anomalous input:
Evaluate the predictor on an anomalous input:
The "Distribution" property is not affected by the anomaly detector:
Temporarily remove the anomaly detector from the predictor:
Permanently remove the anomaly detector from the predictor:
FeatureExtractor (2)
Generate a predictor function using FeatureExtractor to preprocess the data using a custom function:
Add the "StandardizedVector" method to the preprocessing pipeline:
Use the predictor on new data:
Create a feature extractor and extract features from a dataset:
Train a predictor on the extracted features:
Join the feature extractor to the predictor:
The predictor can now be used on the initial input type:
FeatureNames (2)
Train a predictor and give a name to each feature:
Use the association format to predict a new example:
The list format can still be used:
Train a predictor on a training set with named features and use FeatureNames to set their order:
Features are ordered as specified:
Predict a new example from a list:
FeatureTypes (2)
Train a predictor on textual and nominal data:
The first feature has been wrongly interpreted as a nominal feature:
Specify that the first feature should be considered textual:
Train a predictor with named features:
Both features have been considered numerical:
Specify that the feature "gender" should be considered nominal:
IndeterminateThreshold (1)
Specify a probability density threshold when training the predictor:
Visualize the probability density for a given example:
As no value has a probability density above 0.5, no prediction is made:
Specifying a threshold when predicting supersedes the trained threshold:
Update the value of the threshold in the predictor:
Method (4)
Train a nearest-neighbors predictor:
Plot the predicted value as a function of the feature for both predictors:
Train a random forest predictor:
Find the standard deviation of the residuals on a test set:
In this example, using a linear regression predictor increases the standard deviation of the residuals:
However, using a linear regression predictor reduces the training time:
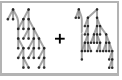
Train a linear regression, neural network, and Gaussian process predictor:
These methods produce smooth predictors:
Train a random forest and nearest-neighbor predictor:
These methods produce non-smooth predictors:
Train a neural network, a random forest, and a Gaussian process predictor:
The Gaussian process predictor is smooth and handles small datasets well:
MissingValueSynthesis (1)
Train a predictor with two input features:
Get the prediction for an example that has a missing value:
Set the missing value synthesis to replace each missing variable with its estimated most likely value given known values (which is the default behavior):
Replace missing variables with random samples conditioned on known values:
Averaging over many random imputations is usually the best strategy and allows obtaining the uncertainty caused by the imputation:
Specify a learning method during training to control how the distribution of data is learned:
Predict an example with missing values using the "KernelDensityEstimation" distribution to condition values:
Provide an existing LearnedDistribution at training to use it when imputing missing values during training and later evaluations:
Specify an existing LearnedDistribution to synthesize missing values for an individual evaluation:
Control both the learning method and the evaluation strategy by passing an association at training:
PerformanceGoal (1)
Train a predictor with an emphasis on training speed:
Find the standard deviation of the residuals on a test set:
By default, a compromise between prediction speed and performance is sought:
With the same data, train a predictor with an emphasis on training speed and memory:
The predictor uses less memory, but is also less accurate:
RecalibrationFunction (1)
Load the Boston Homes dataset:
Train a predictor with model calibration:
Visualize the comparison plot on a test set:
Remove the recalibration function from the predictor:
Visualize the new comparison plot:
TargetDevice (1)
Train a predictor on the system's default GPU using a neural network and look at the AbsoluteTiming:
Compare the previous result with the one achieved by using the default CPU computation:
TimeGoal (2)
Train a predictor while specifying a total training time of 3 seconds:
Load the "BostonHomes" dataset:
Train a predictor while specifying a target training time of 0.1 seconds:
The predictor reached a standard deviation of about 3.2:
Train a classifier while specifying a target training time of 5 seconds:
The standard deviation of the predictor is now around 2.7:
TrainingProgressReporting (1)
Load the "WineQuality" dataset:
Show training progress interactively during training of a predictor:
Show training progress interactively without plots:
Print training progress periodically during training:


Show a simple progress indicator:
UtilityFunction (2)
Visualize the probability density for a given example:
By default, the value with the highest probability density is predicted:
This corresponds to a Dirac delta utility function:
Define a utility function that penalizes the predicted value's being smaller than the actual value:
Plot this function for a given actual value:
Train a predictor with this utility function:
The predictor decision is now changed despite the probability density's being unchanged:
Specifying a utility function when predicting supersedes the utility function specified at training:
Visualize the distribution of age for the name "Claire" with the built-in predictor "NameAge":
The most likely value of this distribution is the following:
Change the utility function to predict the mean value instead of the most likely value:
ValidationSet (1)
Train a linear regression predictor on the "WineQuality" data:
Obtain the L2 regularization coefficient of the trained predictor:
A different L2 regularization coefficient has been selected:
Applications (6)
Basic Linear Regression (1)
Train a predictor that predicts the median value of properties in a neighborhood of Boston, given some features of the neighborhood:
Generate a PredictorMeasurementsObject to analyze the performance of the predictor on a test set:
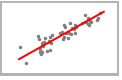
Visualize a scatter plot of the values of the test set as a function of the predicted values:
Compute the root mean square of the residuals:
Weather Analysis (1)
Load a dataset of the average monthly temperature as a function of the city, the year, and the month:
Visualize a sample of the dataset:
Train a linear predictor on the dataset:
Plot the predicted temperature distribution of the city "Lincoln" in 2020 for different months:
For every month, plot the predicted temperature and its error bar (standard deviation):
Quality Assesment (1)
Load a dataset of wine quality as a function of the wines' physical properties:
Get a description of the variables in the dataset:
Visualize the distribution of the "alcohol" and "pH" variables:
Train a predictor on the training set:
Predict the quality of an unknown wine:
Create a function that predicts the quality of the unknown wine as a function of its pH and alcohol level:
Plot this function to have a hint on how to improve this wine:
Interpretable Machine Learning (1)
Load a dataset of wine quality as a function of the wines' physical properties:
Train a predictor to estimate wine quality:
Predict the example bottle's quality:
Calculate how much higher or lower this bottle's predicted quality is than the mean:
Get an estimation for how much each feature impacted the predictor's output for this bottle:
Visualize these feature impacts:
Confirm that the Shapley values fully explain the predicted quality:
Learn a distribution of the data that treats each feature as independent:
Estimate SHAP value feature importance for 100 bottles of wine, using 5 samples for each estimation:
Calculate how important each feature is to the model:
Visualize the model's feature importance:
Visualize a nonlinear relationship between a feature's value and its impact on the model's prediction:
Computer Vision (1)
Generate images of gauges associated with their values:
Train a predictor on this dataset:
Predict the value of a gauge from its image:
Interact with the predictor using Dynamic:
Customer Behavior Analysis (1)
Import a dataset with data about customer purchases:
Train a "GradientBoostedTrees" model to predict the total spending based on the other features:
Use the model to predict the most likely spending by location:
For the top three locations, estimate the spending amount as a function of the customer age:
Compute the model predictions:
Properties & Relations (1)
The linear regression predictor without regularization and LinearModelFit can train equivalent models:
Fit and NonlinearModelFit can also be equivalent:
Possible Issues (1)
The RandomSeeding option does not always guarantee reproducibility of the result:
Train several predictors on the "WineQuality" dataset:
Compare the results when tested on a test set:
Neat Examples (1)
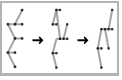
Create a function to visualize the predictions of a given method after learning from 1D data:
Try the function with the "GaussianProcess" method on a simple dataset:
Text
Wolfram Research (2014), Predict, Wolfram Language function, https://reference.wolfram.com/language/ref/Predict.html (updated 2021).
CMS
Wolfram Language. 2014. "Predict." Wolfram Language & System Documentation Center. Wolfram Research. Last Modified 2021. https://reference.wolfram.com/language/ref/Predict.html.
APA
Wolfram Language. (2014). Predict. Wolfram Language & System Documentation Center. Retrieved from https://reference.wolfram.com/language/ref/Predict.html