


TradingChart
TradingChart[{{date1,{open1,high1,low1,close1,volume1}},…}]
makes a chart showing prices and volume for each date.
TradingChart[{"name",daterange}]
makes a financial chart for the financial entity "name" over the daterange.
TradingChart[{…},{ind1,ind2,…}]
makes a financial chart with indicators ind1, ind2, ….
Details and Options
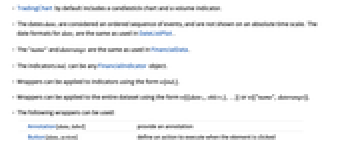
- TradingChart by default includes a candlestick chart and a volume indicator.
- The dates datei are considered an ordered sequence of events, and are not shown on an absolute time scale. The date formats for datei are the same as used in DateListPlot.
- The "name" and daterange are the same as used in FinancialData.
- The indicators indi can be any FinancialIndicator object.
- Wrappers can be applied to indicators using the form w[indi].
- Wrappers can be applied to the entire dataset using the form w[{{date1,ohlcv1},…}] or w[{"name",daterange}].
- The following wrappers can be used:
-
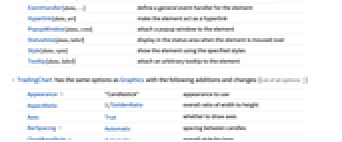
Annotation[data,label]provide an annotation Button[data,action]define an action to execute when the element is clicked EventHandler[data,…]define a general event handler for the element Hyperlink[data,uri]make the element act as a hyperlink PopupWindow[data,cont]attach a popup window to the element StatusArea[data,label]display in the status area when the element is moused over Style[data,opts]show the element using the specified styles Tooltip[data,label]attach an arbitrary tooltip to the element - TradingChart has the same options as Graphics with the following additions and changes: [List of all options]
-
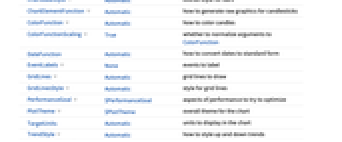
Appearance "Candlestick"appearance to use AspectRatio1/GoldenRatiooverall ratio of width to height AxesTruewhether to draw axes BarSpacing Automaticspacing between candles ChartBaseStyle Automaticoverall style for bars ChartElementFunction Automatichow to generate raw graphics for candlesticks ColorFunction Automatichow to color candles ColorFunctionScaling Truewhether to normalize arguments to ColorFunction DateFunctionAutomatichow to convert dates to standard form EventLabels Noneevents to label GridLines Automaticgrid lines to draw GridLinesStyle Automaticstyle for grid lines PerformanceGoal $PerformanceGoalaspects of performance to try to optimize PlotTheme $PlotThemeoverall theme for the chart TargetUnitsAutomaticunits to display in the chart TrendStyle Automatichow to style up and down trends ScalingFunctions Nonehow to scale the  axis
axis
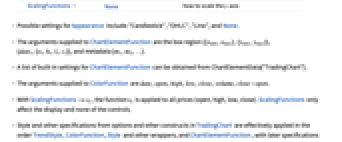
- Possible settings for Appearance include: "Candlestick", "OHLC", "Line", and None.
- The arguments supplied to ChartElementFunction are the box region {{xmin,xmax},{ymin,ymax}}, {datei,{oi,hi,li,ci}}, and metadata {m1,m2,…}.
- A list of built-in settings for ChartElementFunction can be obtained from ChartElementData["TradingChart"].
- The arguments supplied to ColorFunction are date,open,high,low,close,volume,close-open.
- With ScalingFunctions->sy, the function sy is applied to all prices (open, high, low, close). ScalingFunctions only affect the display and none of the controls.
- Style and other specifications from options and other constructs in TradingChart are effectively applied in the order TrendStyle, ColorFunction, Style and other wrappers, and ChartElementFunction, with later specifications overriding earlier ones.
-
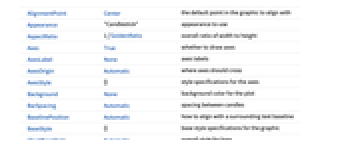
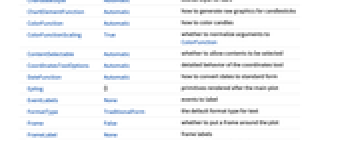
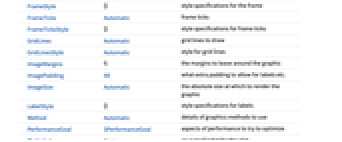
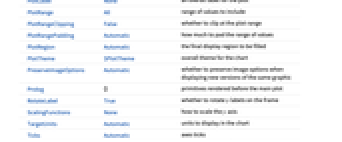
AlignmentPointCenterthe default point in the graphic to align with Appearance"Candlestick"appearance to use AspectRatio1/GoldenRatiooverall ratio of width to height AxesTruewhether to draw axes AxesLabelNoneaxes labels AxesOriginAutomaticwhere axes should cross AxesStyle{}style specifications for the axes BackgroundNonebackground color for the plot BarSpacingAutomaticspacing between candles BaselinePositionAutomatichow to align with a surrounding text baseline BaseStyle{}base style specifications for the graphic ChartBaseStyleAutomaticoverall style for bars ChartElementFunctionAutomatichow to generate raw graphics for candlesticks ColorFunctionAutomatichow to color candles ColorFunctionScalingTruewhether to normalize arguments to ColorFunction ContentSelectableAutomaticwhether to allow contents to be selected CoordinatesToolOptionsAutomaticdetailed behavior of the coordinates tool DateFunctionAutomatichow to convert dates to standard form Epilog{}primitives rendered after the main plot EventLabelsNoneevents to label FormatTypeTraditionalFormthe default format type for text FrameFalsewhether to put a frame around the plot FrameLabelNoneframe labels FrameStyle{}style specifications for the frame FrameTicksAutomaticframe ticks FrameTicksStyle{}style specifications for frame ticks GridLinesAutomaticgrid lines to draw GridLinesStyleAutomaticstyle for grid lines ImageMargins0.the margins to leave around the graphic ImagePaddingAllwhat extra padding to allow for labels etc. ImageSizeAutomaticthe absolute size at which to render the graphic LabelStyle{}style specifications for labels MethodAutomaticdetails of graphics methods to use PerformanceGoal$PerformanceGoalaspects of performance to try to optimize PlotLabelNonean overall label for the plot PlotRangeAllrange of values to include PlotRangeClippingFalsewhether to clip at the plot range PlotRangePaddingAutomatichow much to pad the range of values PlotRegionAutomaticthe final display region to be filled PlotTheme$PlotThemeoverall theme for the chart PreserveImageOptionsAutomaticwhether to preserve image options when displaying new versions of the same graphic Prolog{}primitives rendered before the main plot RotateLabelTruewhether to rotate y labels on the frame ScalingFunctionsNonehow to scale the  axis
TargetUnitsAutomaticunits to display in the chart
TicksAutomaticaxes ticks
TicksStyle{}style specifications for axes ticks
TrendStyleAutomatichow to style up and down trends
axis
TargetUnitsAutomaticunits to display in the chart
TicksAutomaticaxes ticks
TicksStyle{}style specifications for axes ticks
TrendStyleAutomatichow to style up and down trends
List of all options
Examples
open allclose allBasic Examples (4)
Chart the prices from a list of values:
Use three months of prices from FinancialData entities:
Specify a date range for FinancialData entities:
Show a chart with financial indicators:
Scope (25)
Data and Wrappers (9)
Automatically get quarterly data from today:
Get data from a specific date range:
Get data from FinancialData:
Use wrappers on individual data:
Use wrappers on entire datasets:
Override the default tooltips:
Use PopupWindow to provide additional drilldown information:
Button can be used to trigger any action:
Indicators (4)
TradingChart automatically includes the volume indicator:
Specify how many periods to use for the simple moving average using FinancialIndicator:
Indicators may be shown in the main plot or as an additional plot:
Styling and Appearance (8)
Specify styles for up and down trends:
ChartBaseStyle can be used to set a style for all chart elements:
Style can be used to override styles:
Use built-in programmatically generated bars:
Space between candlesticks is automatically adjusted based on the number of data points:
Appearance changes based on the number of data points:
Use a theme with detailed frame ticks and grid lines:
Use a theme with a high-contrast color scheme and edge-fading rectangles:
Labeling (4)
Use Labeled to add a label to a candlestick:
Use symbolic positions for label placement:
Use Placed to control the positioning of labels, using the same positions as for Labeled:
Options (54)
Appearance (3)
TradingChart uses "Candlestick" when there are fewer data points:
TradingChart uses "OHLC" when there are more data points:
Change the appearance of the chart:
None can be used to show only indicators:
BarSpacing (4)
Use automatically determined spacing between candlesticks:
Use explicit spacing between candlesticks:
ChartBaseStyle (5)
Use ChartBaseStyle to style candlesticks:
ChartBaseStyle combines with TrendStyle:
TrendStyle may override settings for ChartBaseStyle:
Style may override settings for ChartBaseStyle:
ChartBaseStyle combines with ColorFunction:
ChartElementFunction (3)
Get a list of built-in settings for ChartElementFunction:
For detailed settings, use Palettes ▶ ChartElementSchemes:
Write a custom ChartElementFunction:
ColorFunction (4)
Color the candlesticks by scaled date, open, high, low, close, or trend value:
Color by the size and direction of price changes:
ColorFunction overrides styles in TrendStyle:
ColorFunctionScaling (2)
By default scaled values are used:
Use ColorFunctionScaling->False to get unscaled values:
EventLabels (6)
Use Placed to control label placement outside the candlestick:
Use positions inside the candlestick:
Place labels at the open, high, low, and close prices:
Use Placed to control label appearance:
GridLines (4)
GridLines are used by default:
Place grid lines at month or year boundaries:
Use dotted grid lines for months and red grid lines for years:
GridLinesStyle (3)
By default GridLinesStyle uses dotted grid lines with emphasized year grid lines:
Use blue grid lines for dates and dotted grid lines for prices:
GridLines overrides GridLinesStyle:
Method (4)
The default mouseover effect is a bouncing ball and axis highlight:
Style the bouncing ball with "HighlightStyle":
Specify the height in pixels for the axis highlight:
PerformanceGoal (3)
Generate a candlestick chart with interactive highlighting:
Emphasize performance by disabling interactive behaviors:
Typically less memory is required for non-interactive charts:
PlotRange (3)
TradingChart automatically draws all price dates:
Limit to a specific date range:
PlotRange only includes dates for which there is data:
PlotTheme (2)
Use a theme with simple ticks and grid lines in a high-contrast color scheme:
ScalingFunctions (2)
Prices are normally shown on a linear scale:
Show prices on a logarithmic scale:
TrendStyle (6)
TrendStyle uses green for up trends and red for down trends by default:
Use black for up trends and red for down trends:
TrendStyle combines with ChartBaseStyle:
With TrendStyle set to None, the base style is used for up trends and empty bars for down trends:
TrendStyle->style uses style for up trends and empty bars for down trends:
Properties & Relations (3)
Use InteractiveTradingChart to visualize and interactively analyze financial data:
Use PointFigureChart, LineBreakChart, RenkoChart, and KagiChart to analyze the relation of financial prices and time:
Use DateListPlot to visualize financial data:
Text
Wolfram Research (2010), TradingChart, Wolfram Language function, https://reference.wolfram.com/language/ref/TradingChart.html (updated 2014).
CMS
Wolfram Language. 2010. "TradingChart." Wolfram Language & System Documentation Center. Wolfram Research. Last Modified 2014. https://reference.wolfram.com/language/ref/TradingChart.html.
APA
Wolfram Language. (2010). TradingChart. Wolfram Language & System Documentation Center. Retrieved from https://reference.wolfram.com/language/ref/TradingChart.html